Do you want to find the runtime score of Core Web Vitals metrics (LCP, CLS) for your website to fix the user experience issues and pass the Core Web Vitals assessment? You’re in the right place.
In this tutorial, we will guide you step-by-step on how to find/measure & fix the runtime score of Core Web Vitals metrics for your website using Google Chrome’s developer tool Performance Insights.
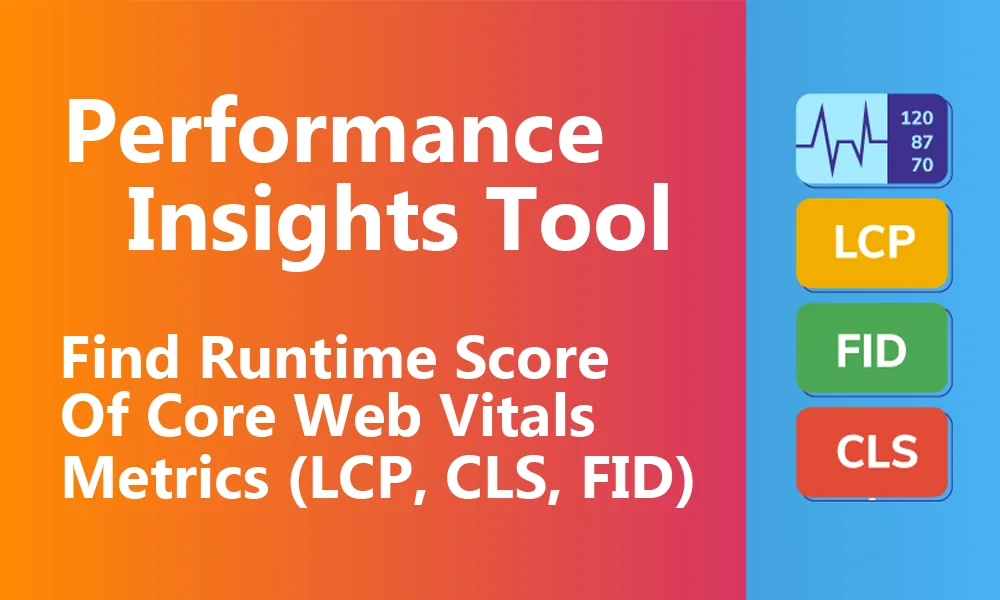
The Performance Insights is a powerful tool that provides you useful actionable insights on your website performance issues & Core Web Vitals metrics within the scope of predefined Network, CPU and Device settings. By fixing the performance issues and improving the LCP, CLS, & FID scores, you can actually Pass the Core Web Vitals assessment for your website.
If you don’t know What are Core Web Vitals Metrics (LCP, CLS, FID), go through the section (01. What are Google Core Web Vitals?) of this this tutorial:
- HowTo Pass Core Web Vitals Test for a WordPress Blog
- How to Remove Lazy Loading on Featured Image in WordPress
Following topics will be covered in this post:
- Core Web Vitals Lab Data vs Field Data
- How to Use Performance Insights Tool
01. Core Web Vitals Lab Data vs Field Data
In this section you will learn the difference between Core Web Vitals Lab Data and Field Data, and also, Why PageSpeed Insights measurement details are not enough to fix LCP and CLS issues?
Google PageSpeed Insights is a website where you can (1) Measure the performance score of your website (2) Measure Lab Data & Field Data Core Web Vitals metrics score (3) Know whether your Core Web Vitals assessment is Failed or Passed (4) Diagnose performance issues of your website.
01. Field Data
In Field Data, the Core Web Vitals metrics (LCP, FID, CLS) of a page are measured/assessed/collected based on realtime user-experience data. The Chrome UX (User Experience) also known as CrUX contains the real (field) user experience on millions of websites.
The metrics data comes from all types of internet connection speeds and end-user devices:
- Slow-speed internet connections, slow devices
- Slow-speed internet connections, fast (latest) devices
- Fast-internet connections, fast (latest) devices
- Fast-internet connections, slow devices
The Core Web Vitals assessment is based on the Field Data. If a website’s Field Data fails to achieve all of the Core Web Vitals metrics (LCP, FID, CLS) thresholds, the Core Web Vitals assessment is Failed.
Following are the Core Web Vitals metrics thresholds that 75% of your website page visits must cross:
- For LCP, the threshold is less than or equal to 2.5 seconds for 75% page visits of a website.
- For FID, the threshold is less than or equal to 100 ms, for 75% page visits of a website.
- For CLS, the threshold is less than or equal to 0.1, for 75% page visits of a website.
Below is the Field Data of a website. The Core Web Vitals assessment is Failed because 75% of website traffic is failed to achieve the LCP & CLS thresholds. Here, only FID score is less than or equal to 100ms for 75% of page visits, which is 43 ms for 83% of page visits.

Why PageSpeed Insights Measurement Details are Not Enough?
Though PageSpeed Insights provides you the Core Web Vitals Metrics Scores, Percentage of Page Visits, Diagnose Performance Issues, but it doesn’t provide:
- How your website is performing on different internet connections and devices in runtime (field).
- How different internet connections and devices are affecting the Core Web Vitals metrics (LCP, CLS) in runtime.
- Which individual Libraries/Files/Scripts, HTML, CSS, Image, and Media of a website or website pages are effecting the Core Web Vitals metrics (LCP, CLS) scores in runtime.
To overcome the shortcomings of PageSpeed Insights, Chrome developers came up with a very advanced and powerful tool called Performance Insights, that helps you to troubleshoot the performance issues of a website in runtime with predefined settings.

02. Lab Data
In Lab Data, the Core Web Vitals metrics (LCP, CLS) of a website are measured/tested in a controlled environment with a predefined internet connection and device.
The Lab Data is used to diagnose the performance issues of your website pages, that ultimately helps you to improve the Core Web Vitals performance score and Field Data metrics score.
Below is the Lab Data of the same website measured on PageSpeed Insights. The Performance Score is 57, which is neither too good not too bad. You can see the Core Web Vitals metrics scores of LCP & CLS in Lab. LCP is 3.6 seconds and CLS is 0.038.
The third Core Web Vitals metric FID (First Input Delay) cannot be measured in Lab. FID can only be measured in Field because it needs a real-user interaction with your page. However, you can improve/optimize the TBT (Total Blocking Time) metric, because it correlates with FID in the Field. By optimizing the TBT in Lab you can improve the FID in field.

02. How to Use Performance Insights Tool
In this section you will learn how to use Chrome’s Performance Insights tool/panel to find the runtime score of Core Web Vitals metrics (LCP, CLS) for a page.
- Open your desired website or a page on Google Chrome browser.
- Press F12 or Ctrl + Shift + I on your keyboard to open Developer Tools.
- Go to Performance insights tab.
- Click on the No throttling dropdown-list to expand the options. There are three options [1] Network (Internet Speeds like 3G, 4G) [2] CPU (Device Performance like 4x slowdown, 6x slowdown) [3] Disable Cache (Cache enhances the performance of a device).
- No Throttling means without any break, restriction, barrier, limit, etc. By setting the No Throttling option for Network & CPU you will be measuring the performance of your website in ideal conditions.
- Here we are going to measure the performance of website by changing the Network and CPU settings, as you can see in the next step.

We will measure the performance of a website with below settings to know how it is performing on slow network connection and devices.
- Network: Slow 3G
- CPU: 4x Slowdown
- Disable Cache
Click the Measure page load button to begin the process. It reloads the whole page again and collects the data. It takes sometime to display the results, so be patient.

You can see the measurement results on a Timeline. The Layout Shift section is divided into 2 rows. The top row contains CLS (Cumulative Layout Shift) activity whereas the lower row shows the screenshot of the elements causing the layout shift. At your right-side you can find Insights on CLS. Here it is 0.141. The factors which are causing the layout shift are listed just above the Cumulative Layout Shift heading on Insights. Click on them to open on Detail tab, in order to find the Potential Root Cause, Elements Impacted, and a solution.
The LCP is shown on top of the Layout Shift section. Move your mouse on top of it to see the LCP score. Here it is 28.69 seconds. The LCP should be less than or equal to 2.5 seconds. You can go to Insights and scroll down to LCP section and find the factors which are contributing to the large LCP of a page. Click on those factors one-by-one to fix them.
The Red Circle (Start Recording) option allows you to record the whole activity of page loading. It automatically stops when the page loading is finished.
At bottom, you can see a Media Player through which you can replay the whole loading activity (timeline) of a page. You can preview how things are happening in runtime while a page is loading.

- Just below the Layout Shifts section there is a Network section. Click on it to expand the Network activity in the Network track, as shown in the next step.
- You can directly find HTML, CSS, JavaScript, Font, Images, Media, etc, which are affecting the performance and Core Web Vitals metrics of a page. Each of them is represented with a unique color.

- Here you can see the Network activity is expanded. It contain all those files, scripts, elements, etc, which are affecting the page performance. Click on them to know how they are affecting the performance.
- In the next step we have identified the element which is contributing to large LCP score.

- There is a PNG image which is causing the large LCP score. You can see on the Details that the Download time of image is 28.561 seconds in a slow internet connection.
- In the next step, we have opened the details of a JavaScript library/script which is delaying the rendering of a page.

- The Details is showing that the JavaScript library contains a Render blocking script. It means that script in the library (rbtools.min.js) is blocking or delaying the browser from rendering the page content to the screen, that could affect both LCP and FID metrics.
- To fix the issue, it is recommending to add an async or defer attribute to the script tag, so that it can be executed later, once the content is rendered.

Conclusion
So it was a brief introduction about using the Chrome Performance insights tool. We have covered its important features. There is lot more to explore on it. After fixing the performance issues, measure your Core Web Vitals metrics again with different Network and CPU settings, to make sure that your website is providing a good page user experience on any network and device.
Also Read


Leave a Reply